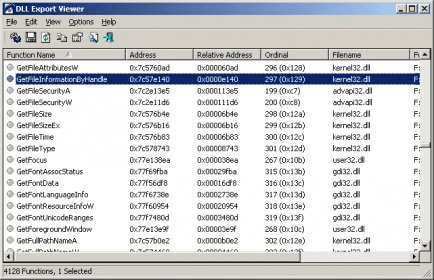
This utility displays the list of all exported functions and their virtual memory addresses for the specified DLL files. You can easily copy the memory address of the desired function, paste it into your debugger, and set a breakpoint for this memory address. When this function is called, the debugger will stop in the beginning of this function.
For example: If you want to break each time that a message box is going to be displayed, simply put breakpoints on the memory addresses of message-box functions: MessageBoxA, MessageBoxExA, and MessageBoxIndirectA (or MessageBoxW, MessageBoxExW, and MessageBoxIndirectW in unicode based applications) When one of the message-box functions is called, your debugger should break in the entry point of that function, and then you can look at call stack and go backward into the code that initiated this API call.
It's a powerful PDF viewing application with a lot of features and options.
PE Explorer makes it easy to view, analyze and edit win32 executable files (EXE, DLL, SYS, ActiveX).


Comments